
Discover how the Fitbit app screen works, what every feature means, and how to use its health insights to improve daily wellness.
The Fitbit app screen is the main dashboard inside the Fitbit app where users can view activity, sleep, heart rate, exercise, wellness, and health metrics. It transforms raw fitness data into easy-to-understand insights that help users track habits, monitor progress, and make informed lifestyle decisions.
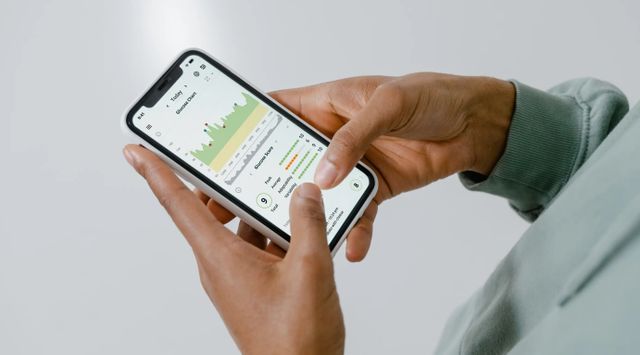
The first time many people open the Fitbit app screen, there’s a brief moment of confusion.
The colorful charts look impressive. The numbers seem important. The graphs stretch across the display like a language the body has been speaking all along, yet few people fully understand it.
I remember expecting something simple. A step counter. Maybe a calorie estimate. Instead, the screen felt like a digital journal written by my own habits.
There were sleep scores that reflected late-night decisions. Heart rate trends that quietly revealed stressful weeks. Activity summaries that exposed how often I thought I was moving when I actually wasn’t.
That’s what makes the Fitbit app screen different from a traditional fitness tracker dashboard.
It doesn’t just count movement.
It tells stories.
Some stories are encouraging. Others are uncomfortable. But almost all of them reveal something useful.
Understanding the Fitbit app screen allows users to move beyond collecting data and start interpreting it. Once that shift happens, the app becomes less about numbers and more about self-awareness.
This guide explores every major section of the Fitbit app screen, explains what the metrics actually mean, and shows how they work together to create a clearer picture of overall health.
Understanding the Purpose of the Fitbit App Screen
At its core, the Fitbit app screen exists to answer one question:
How is your body doing today?
Every card, graph, metric, and notification serves that purpose.
The app gathers information from Fitbit devices and organizes it into meaningful categories. Instead of presenting endless streams of sensor data, it translates information into practical insights.
The Fitbit app screen typically tracks:
- Daily activity
- Step count
- Calories burned
- Heart rate
- Sleep quality
- Exercise sessions
- Stress indicators
- Weight trends
- Hydration goals
- Wellness metrics
Think of it as the dashboard of a modern vehicle.
Thousands of processes occur beneath the surface, but the driver only sees the indicators that matter most. Fitbit applies the same principle to personal health.
The result is a simplified yet surprisingly detailed overview of daily wellness.
The Main Layout of the Fitbit App Screen
The Today Dashboard
The Today tab acts as the heart of the Fitbit app screen.
This is where users spend most of their time because it provides a snapshot of current progress.
Instead of hiding information behind multiple menus, Fitbit organizes important metrics into cards that can be viewed at a glance.
Typical cards include:
- Steps
- Sleep
- Exercise
- Heart Rate
- Calories
- Weight
- Stress Management
- Active Zone Minutes
- Water Intake
One of the strengths of the Fitbit app screen is flexibility.
Users can rearrange these cards based on their goals.
Someone training for endurance events might place exercise and heart rate metrics at the top. Another person focused on recovery may prioritize sleep and readiness scores.
This customization transforms the app from a generic dashboard into a personal health command center.
Activity Tracking on the Fitbit App Screen
Step Count Tracking
For many users, step tracking remains the most familiar feature.
The Fitbit app screen displays:
- Current step count
- Daily goal progress
- Weekly trends
- Historical averages
At first glance, steps seem straightforward.
Walk more. Improve health.
But the reality is more nuanced.
A person who walks 8,000 steps every day often develops more sustainable habits than someone who occasionally reaches 15,000 steps but remains inactive most of the week.
The Fitbit app screen highlights consistency rather than isolated achievements.
This subtle shift changes how many users approach movement.
Distance and Floors
Depending on the Fitbit device, users may also see:
- Distance traveled
- Floors climbed
- Elevation changes
These measurements provide additional context.
Ten thousand steps taken during a mountain hike create a very different physical demand than ten thousand steps taken on flat ground.
The Fitbit app screen helps reveal those differences.
Calories Burned
Calories burned are often one of the most misunderstood metrics.
The app combines:
- Basal metabolic rate
- Daily movement
- Exercise activity
This creates a more comprehensive estimate of total energy expenditure.
The number isn’t perfect.
No wearable device can measure calorie burn with absolute precision.
However, trends over time can be highly useful for understanding activity patterns.
Active Zone Minutes: A Smarter Fitness Metric
Why Fitbit Introduced Active Zone Minutes
Traditional activity trackers focus heavily on quantity.
Active Zone Minutes focus on quality.
Instead of simply counting movement, the Fitbit app screen measures how intensely the body is working.
Minutes are earned when heart rate reaches specific target zones.
Examples include:
- Fast-paced walking
- Running
- Cycling
- Swimming
- High-intensity interval training
This approach reflects a growing understanding in fitness science.
Not all movement creates the same physiological response.
Thirty minutes of vigorous exercise often produces different benefits than thirty minutes of casual walking.
The Fitbit app screen captures that distinction.
Understanding Heart Rate Zones
Active Zone Minutes are built around three heart rate zones:
Fat Burn Zone
Moderate effort that can be sustained for longer periods.
Cardio Zone
Higher intensity designed to improve cardiovascular fitness.
Peak Zone
Maximum effort levels associated with intense workouts.
These zones provide valuable context that simple step counts cannot.
Sleep Tracking on the Fitbit App Screen
Why Sleep Matters
Many people buy a Fitbit to improve fitness.
Ironically, some of the most valuable insights come from sleep tracking.
The Fitbit app screen treats sleep as a foundational health metric rather than an afterthought.
This makes sense.
Recovery influences nearly every aspect of performance, energy, and well-being.
Sleep Score Breakdown
The Fitbit app screen combines multiple factors into a single sleep score.
These factors include:
- Sleep duration
- Sleep quality
- Restlessness
- Sleep stages
- Recovery indicators
A high score suggests effective recovery.
A lower score may indicate disruptions, insufficient sleep, or poor sleep quality.
The beauty of the system is simplicity.
Instead of overwhelming users with technical data, Fitbit translates complex sleep information into a digestible score.
Sleep Stages Explained
The Fitbit app screen typically separates sleep into three stages.
Light Sleep
The body’s transition phase between wakefulness and deeper sleep.
Deep Sleep
The stage most associated with physical recovery and restoration.
REM Sleep
A critical stage for learning, memory consolidation, and emotional processing.
The visual graphs make these stages easier to understand.
Many users discover patterns they never expected.
Sleeping longer does not always mean sleeping better.
Heart Rate Monitoring Features
Resting Heart Rate
One of the most valuable metrics on the Fitbit app screen is resting heart rate.
This number represents how many times the heart beats per minute while the body is at rest.
Tracking resting heart rate over time can reveal meaningful trends.
Potential influences include:
- Fitness improvements
- Stress
- Illness
- Recovery status
- Sleep quality
The number itself matters less than its direction.
A gradual decrease may suggest improving cardiovascular fitness.
A sudden increase may indicate fatigue or stress.
Daily Heart Rate Trends
The Fitbit app screen also displays heart rate patterns throughout the day.
These trends often uncover hidden relationships.
For example:
- Poor sleep may increase resting heart rate.
- Stressful workdays may produce unusual spikes.
- Consistent exercise may improve recovery.
The data becomes more useful as weeks and months accumulate.
Exercise Tracking and Workout Insights
Automatic Workout Recognition
One feature many users appreciate is automatic exercise detection.
The Fitbit app screen can identify common activities such as:
- Walking
- Running
- Cycling
- Elliptical workouts
This reduces the need to manually start every workout session.
The device recognizes movement patterns and heart rate changes to classify activity.
Post-Workout Reports
After exercise, the Fitbit app screen generates summaries showing:
- Duration
- Distance
- Calories burned
- Heart rate zones
- Pace information
These reports transform exercise into measurable progress.
Instead of relying on memory, users can review objective performance data.
Stress Management Features
Measuring More Than Physical Fitness
Health isn’t solely determined by activity levels.
Stress affects recovery, sleep, motivation, and long-term wellness.
The Fitbit app screen acknowledges this reality through stress-related features.
Stress Management Score
The score considers multiple inputs, including:
- Activity patterns
- Sleep quality
- Heart rate trends
- Recovery indicators
While stress cannot be measured perfectly by a wearable device, these insights often reveal meaningful patterns.
Users frequently notice correlations between stressful periods and declining wellness metrics.
Nutrition and Hydration Tracking
Food Logging
The Fitbit app screen can function as a nutrition companion.
Users may track:
- Meals
- Snacks
- Calories
- Macronutrients
Food tracking helps create awareness.
Many people underestimate how much they consume or overestimate how much they burn.
The app bridges that gap.
Water Tracking
Hydration tracking appears simple, but it serves an important purpose.
Even mild dehydration can affect:
- Energy levels
- Exercise performance
- Cognitive function
The Fitbit app screen encourages consistency by displaying progress toward hydration goals.
Fitbit Premium Features
What Fitbit Premium Adds
The standard Fitbit experience provides substantial information.
Premium expands the depth of analysis.
Additional features often include:
- Advanced sleep insights
- Wellness reports
- Guided programs
- Health trend analysis
- Recovery assessments
The interface remains familiar.
Users simply gain access to more detailed interpretation.
Daily Readiness Score
One of the most interesting Premium features is the Daily Readiness Score.
The concept is surprisingly practical.
Instead of asking how much exercise you’ve done, it asks:
How prepared is your body for exercise today?
The score considers:
- Sleep quality
- Recent activity
- Recovery status
This helps users balance effort and recovery more effectively.
Customizing the Fitbit App Screen
Rearranging Cards
The Fitbit app screen allows users to prioritize what matters most.
Someone focused on weight management may highlight calorie and nutrition tracking.
An endurance athlete may focus on heart rate and exercise metrics.
Customization improves usability because relevant information becomes easier to access.
Goal Setting
The app allows users to create goals for:
- Steps
- Sleep
- Exercise
- Weight
- Water intake
Goals create structure.
More importantly, they provide feedback loops that encourage consistency.
Small wins accumulate over time.
Fitbit App Screen Comparison
| Feature | Free Version | Premium Version |
| Step Tracking | Yes | Yes |
| Sleep Tracking | Yes | Yes |
| Heart Rate Monitoring | Yes | Yes |
| Advanced Sleep Insights | Limited | Extensive |
| Readiness Score | Limited | Available |
| Wellness Reports | Basic | Detailed |
| Guided Programs | Limited | Expanded |
| Long-Term Health Trends | Basic | Advanced |
The difference is less about collecting additional data and more about gaining deeper interpretation.
Common Fitbit App Screen Problems
Syncing Issues
Occasionally, users notice delays in data updates.
Common causes include:
- Bluetooth interruptions
- Low battery levels
- App permissions
- Software updates
Most synchronization problems can be resolved through reconnection or restarting devices.
Missing Metrics
Missing data often results from:
- Improper device placement
- Disabled tracking settings
- Sensor obstructions
Consistent device usage generally improves accuracy.
The Evolution of the Fitbit App Screen
The Fitbit app screen has evolved significantly over the years.
Early fitness trackers focused almost entirely on steps.
Today’s Fitbit ecosystem monitors a far broader range of health indicators.
This reflects a larger shift in wellness technology.
People increasingly want context rather than isolated numbers.
They want to understand relationships.
How does sleep affect exercise?
How does stress influence recovery?
How does activity impact heart health?
The Fitbit app screen attempts to answer those questions by connecting data points into meaningful patterns.
Why the Fitbit App Screen Is More Than a Dashboard
After months of using Fitbit, something interesting happens.
You stop checking individual metrics.
Instead, you start looking for connections.
A poor night’s sleep explains low energy.
Higher stress predicts elevated heart rate.
Consistent exercise improves recovery.
The Fitbit app screen gradually becomes less about tracking and more about understanding.
That’s where its real value lies.
Not in counting steps.
Not in chasing badges.
But in helping users recognize the invisible patterns shaping their daily lives.
The screen doesn’t change behavior on its own.
It simply shines a light on habits that were already there.
Sometimes that awareness is enough to spark meaningful change.
FAQ Section
What is the Fitbit app screen?
The Fitbit app screen is the main dashboard within the Fitbit app where users view activity, sleep, heart rate, exercise, wellness, and health-related metrics.
Can I customize the Fitbit app screen?
Yes. Users can rearrange cards, prioritize metrics, and customize goals to match personal health and fitness objectives.
Why is my Fitbit app screen not updating?
Common causes include Bluetooth connectivity issues, synchronization delays, software updates, or low device battery levels.
Does Fitbit Premium change the Fitbit app screen?
The layout remains similar, but Premium adds advanced insights, readiness scores, wellness reports, and deeper health analysis.
What is the most useful feature on the Fitbit app screen?
Many users consider sleep tracking, heart rate trends, and Active Zone Minutes among the most valuable features because they provide actionable health insights.
Key Takings
- The Fitbit app screen acts as a centralized health and fitness dashboard.
- Activity, sleep, heart rate, and wellness metrics work together to provide a complete picture of daily health.
- Active Zone Minutes focus on exercise intensity rather than movement alone.
- Sleep tracking often delivers some of the most valuable long-term health insights.
- Heart rate trends can reveal changes in recovery, fitness, and stress levels.
- Fitbit Premium enhances the Fitbit app screen with deeper analysis and readiness features.
- The true value of the Fitbit app screen comes from understanding patterns rather than obsessing over individual numbers.


